Charlotte's rapid urban expansion over the past three decades, from a modest textile hub to the second-largest banking center in the U.S., has placed unprecedented demand on understanding local soil behavior. The city sits atop the Piedmont physiographic province, where residual soils derived from weathered granite and gneiss dominate the subsurface. These saprolitic profiles often retain the parent rock's fabric but exhibit drastically reduced strength, making grain size analysis a critical first step in any geotechnical investigation. Before we even consider bearing capacity or settlement, we need to know the particle size distribution — whether it's the coarse fraction that governs drainage or the fine fraction that controls plasticity. The method pairs mechanical sieving for particles larger than 75 microns with hydrometer sedimentation for the silt and clay fractions, following ASTM D422 and D6913 protocols. This data directly feeds into the USCS classification system per ASTM D2487, which then informs everything from shallow foundation design to slope stability assessments. In Charlotte's Piedmont soils, the sand-silt-clay ratios vary dramatically within a single site, so skipping this test often leads to overconservative designs or, worse, unexpected settlements during construction. We routinely combine this analysis with a study of soil mechanics to correlate gradation with engineering behavior for the specific residual profiles found in this region.
The sand-silt-clay ratios in Charlotte's Piedmont soils vary dramatically within a single site; skipping grain size analysis often leads to unexpected settlements during construction.
Scope of work
Area-specific notes
In Charlotte, we often see projects where the grain size analysis was performed only on a single bulk sample, ignoring the vertical and lateral variability typical of Piedmont residual profiles. The transition from a sandy silt at 2 meters to a clayey sand at 4 meters can happen within a few feet, and if the gradation data doesn't capture that, the compaction specifications and drainage design will be wrong. Another common hazard is misinterpreting the hydrometer results when the clay fraction is actually finely ground silt from weathered mica schist — a mineralogy issue that requires combining gradation with Atterberg limits to confirm plasticity. We've seen retaining wall failures in the Myers Park area where backfill was specified as granular but actually contained enough fines to become saturated and lose shear strength after heavy rain. The grain size distribution directly governs the soil's hydraulic conductivity, and in Charlotte's stormwater-intensive environment, getting this wrong can lead to differential settlement, clogged drainage systems, or even slope instability.
Standards used
ASTM D422-63(2007) Standard Test Method for Particle-Size Analysis of Soils, ASTM D6913/D6913M-17 Standard Test Methods for Particle-Size Distribution (Gradation) of Soils Using Sieve Analysis, ASTM D7928-21 Standard Test Method for Particle-Size Distribution (Gradation) of Fine-Grained Soils Using the Sedimentation (Hydrometer) Analysis, ASTM D2487-17 Standard Practice for Classification of Soils for Engineering Purposes (Unified Soil Classification System)
Linked services
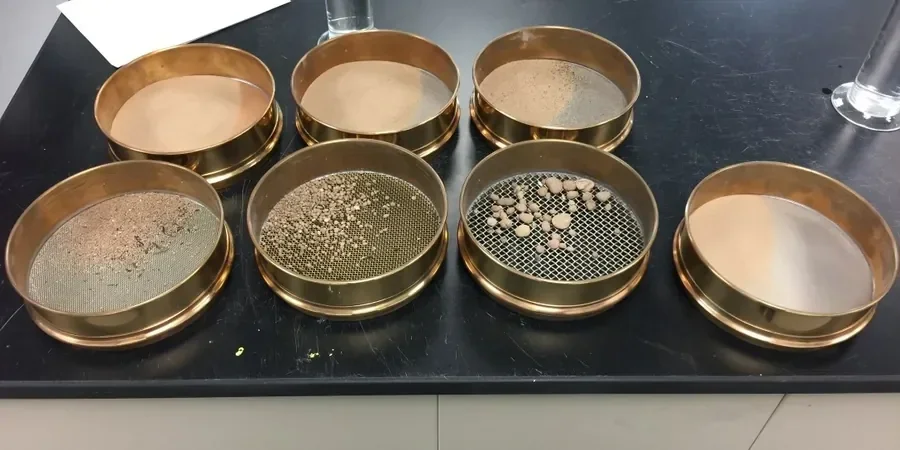
Mechanical Sieve Analysis (ASTM D6913)
Full gradation using 8-inch sieves from 4.75 mm down to 0.075 mm, with reporting of Cu, Cc, and USCS classification. Suitable for granular fills, subgrade soils, and aggregate base courses.
Combined Sieve and Hydrometer Analysis (ASTM D422 + D7928)
For soils with more than 10 percent passing the #200 sieve. Includes hydrometer sedimentation with 152H hydrometer at timed intervals, dispersion with sodium hexametaphosphate, and complete gradation curve down to 0.5 microns.
Wet Sieve Analysis for Fine-Grained Soils
Wash-sieving technique to remove clay coatings on sand particles before dry sieving, providing accurate gradation for high-plasticity clays and silts common in Charlotte's saprolitic profiles.
Typical parameters
Top questions
What is the difference between sieve analysis and hydrometer analysis?
Sieve analysis separates soil particles by passing them through a series of stacked sieves with progressively smaller openings, down to 0.075 mm (#200 sieve). Hydrometer analysis measures the settling velocity of particles finer than 0.075 mm in a water column, using Stokes' law to calculate particle diameter. Sieve analysis covers sand and gravel sizes, while hydrometer analysis extends the range down to clay-sized particles (0.5 microns). For complete characterization of Charlotte's residual soils, both methods are typically combined.
How much does grain size analysis cost in Charlotte?
The typical cost for a combined sieve and hydrometer analysis in Charlotte ranges from US$100 to US$160 per sample, depending on the number of sieve fractions required and whether wet sieving is needed. Bulk discounts are available for projects requiring multiple samples. The price includes sample preparation, sieving, hydrometer readings at specified time intervals, calculation of Cu, Cc, and USCS classification per ASTM D2487.
How long does a grain size analysis take?
A standard sieve analysis can be completed within 2-3 business days, as it involves drying, sieving, and weighing. When hydrometer analysis is included, the total turnaround time extends to 5-7 business days because the hydrometer readings span 24 hours (with readings at 1, 2, 5, 15, 30, 60, 250, and 1440 minutes), followed by calculations and reporting. Rushed services can be arranged for time-sensitive projects.
Why is grain size analysis important for Charlotte construction projects?
Charlotte's Piedmont soils are highly variable, with gradations changing within meters horizontally and vertically. Grain size analysis determines the soil's drainage characteristics, compaction behavior, frost susceptibility, and suitability as fill or subgrade. For example, a silty sand (SM) will compact differently than a clayey sand (SC), and a well-graded gravel (GW) provides better drainage than a poorly graded sand (SP). Without accurate gradation data, foundation designs, pavement sections, and retaining wall backfills may fail to perform as intended.